Case Study · February 2026
Sizing & Fit Returns
A problem I kept running into myself, that also turned out to be a $400M+-a-year problem for URBN.
The problem
Quantitatively, sizing and fit issues are the single biggest driver of returns in apparel. Qualitatively, the dissatisfaction of ordering something that doesn't fit, then having to send it back, adds friction to the buying decision itself and to the shopping experience as a whole. I wanted to figure out why it's still so hard to buy the right size online, see what other brands were doing about it, and find the gaps the existing solutions weren't solving yet.
How I sized it
URBN doesn’t publish its return rate or the share of returns driven by fit, so the number is a triangulation from public financials and industry benchmarks. I held the inputs conservative on purpose and stress-tested the range:
| Scenario | Apparel revenue (est.) | Return rate | Fit/size share | Fit/size return cost |
|---|---|---|---|---|
| Conservative | ~$3.24B | 24% | 53% | ~$412M |
| Base case | ~$3.24B | 30% | 53% | ~$516M |
| High | ~$3.24B | 35% | 53% | ~$602M |
The inputs, and where they come from:
- Apparel revenue ~$3.24B. URBN reported $5.55B in total FY2025 net sales (year ended Jan 31, 2025). URBN bundles apparel with home, beauty, and the Nuuly rental business rather than breaking it out directly; csimarket's segment analysis puts apparel (retail + wholesale combined) at 58.42% of revenue for the same fiscal year.
- Return rate 24–35%. Coresight measured a 24.4% online apparel return rate over a trailing 12 months; the broader industry norm runs 20–30%, with some fashion categories pushing 40%. I used 24% as the floor.
- Fit/size share 53%. From Coresight. This is almost certainly conservative: McKinsey's returns-management research puts 70% of apparel returns down to poor fit or style.
The headline number quotes the conservative floor. The realistic base case is closer to $516M, and a higher fit-share assumption pushes it past $600M. Even a 1–2 point improvement in fit-related returns is worth $17–35M+ a year.
The bet
Right now, sizing only shows up after someone has already decided they want an item. They fall for something, then have to reverse-engineer their size from a chart and a handful of reviews. They have to make a decision right when they’re most excited and least equipped to deliberate.
Move sizing confidence from the point of decision to the point of discovery. Instead of a retroactive hurdle bolted onto "add to cart" or "checkout", fit should help shape what a shopper sees in the first place. Incorporate sizing and fit confidence throughout the journey so they are no longer a question.
Goals
Decrease returns tied to sizing and fit while increasing customer loyalty, anchored to three measurable targets.
Bracketing (ordering one item in several sizes to send most back) is a major driver of apparel returns, and True Fit's own case data shows bracketing declines of 24% at Moosejaw and 30–50% at ASICS after adopting fit tools. The 3% target sits at the conservative end of what similar tools have delivered: Fit Analytics' published case studies show return-rate reductions ranging from 2% at Breuninger up to 20% at Mammut.
Research
I audited what already existed and where it fell short, then combined it with secondary research on shopper behavior. The result: a journey map and a set of opportunity areas.
Exhibit 1. Competitive teardown
I walked through the online fit process for eight apparel retailers and ranked each on how much confidence the experience actually delivered (1 = best). The pattern was clear: the leaders all push the sizing decision onto a quiz or fit assistant; the laggards leave the shopper to interpret raw charts and reviews alone.
| Retailer | Approach | Differentiator | Rank |
|---|---|---|---|
| ASOS | Fit quiz + fit assistant | Fit Analytics-powered assistant | 1 |
| lululemon | Fit quiz | True Fit | 1 |
| Tommy Hilfiger | Fit quiz | Fit Finder (Fit Analytics) | 1 |
| Zara | In-house fit quiz | Quiz with optional measurement entry | 2 |
| Uniqlo | Fit quiz | “Compare sizes” page, alteration options | 2 |
| Urban Outfitters | Charts + reviews only | Aggregated “runs small/large” review signal | 3 |
| Madewell | Charts + reviews only | Wide size range (petite, tall, plus) | 3 |
| H&M | Charts + reviews only | Consistent UX across categories | 3 |
Exhibit 2. Third-party fit tools
The eight tools split into a few families: quiz-based recommenders, digital-twin/body-scanning tools, virtual try-on, and styling services.
| Tool | Approach | Fit inputs collected | Markets |
|---|---|---|---|
| Fit Analytics | Quiz + comparison-based recommender | Body proportions, gender, height, weight, age, belly/hip shape, bra size, fit preference, comparison items, satisfaction likelihood | Apparel brands |
| True Fit | Cross-brand quiz + shopper app | Body proportions, height, weight, age, inseam, comparison items | Shoppers & apparel brands |
| Virtusize | Fit-based recs + try-on sketch | Gender, height, weight, age | Apparel brands |
| Stitch Fix | Styling quiz, improves with use | Height, weight, body shape, comparison items, bra size | Shoppers |
| Bold Metrics | Digital-twin sizing | Age, height, weight, bra size | Apparel brands |
| Sizebay | Body-avatar try-on | Height, weight, age, body shape | Apparel brands |
| 3DLook | Body-scanning for custom fit | Body scan only | Health & fitness, apparel brands, custom apparel |
| Google Try On | Virtual try-on (photo) | Photo only | Shoppers |
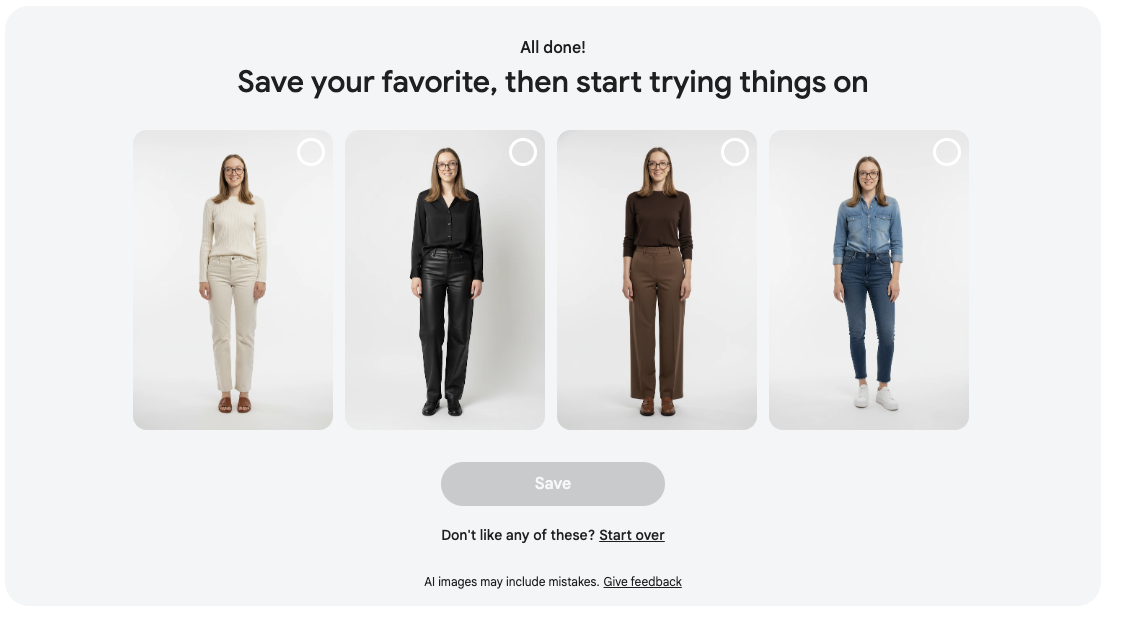
Exhibit 3. Auditing URBN’s sizing + fit flow
High cognitive load
Shoppers self-measure from written instructions: no video, minimal imagery.
Different rules per garment
Tops, bottoms, dresses, and jeans each need different measurements, with no consistent pattern to learn.
Nowhere to store anything
Measurements are re-derived from scratch on every visit; nothing persists.
Conflicting signals
Shoppers have to reconcile the size chart against what reviewers say about fit, and the two often disagree.
Scattered information
Model measurements live in one place, the size chart in another, fit reviews in a third.
Edge cases break the chart
When a shopper’s waist and hips fall in different size columns, the chart offers no way to decide.
Exhibit 4. Journey map
Mapping the journey of a new UO online jeans shopper across ten stages showed that fit anxiety isn’t a single moment: it builds, peaks at the size decision, and then falls off when reassurance would help most.
| Stage | Fit-related pain point | Opportunity |
|---|---|---|
| Discover | No size availability or fit cues on tiles | “Best for [fit]” tags; show availability |
| Size Decision | Generic charts, contradictory reviews | Personalized rec + “why this size” |
| Add to Cart | Fit info vanishes in the cart | Fit summary in cart (“Recommended 28: based on…”) |
| Keep / Return | Returns are pure time-cost | Smart exchange flow, auto size correction |
| Reflect & Learn | Learning stays in the shopper’s head | Persistent, editable fit profile |
The counterintuitive finding
A peer-reviewed study of a high-end retailer’s size finder (Patel et al., 2025; see Sources) found that shoppers who used the tool were actually 0.65% more likely to return an item, yet for each quarter of continued use, customer lifetime value rose ~7.5% in the following quarter.
It seems, then, that fit tools aren’t primarily a returns-reduction lever; they’re a confidence-and-loyalty lever.
Next Assumptions to Test
Three assumptions to test came out of the research:
- A dedicated fit assistant at the point of size selection will improve confidence. (Exhibit 1: Many competitors are experimenting with this.)
- Fit signals need to appear earlier and persist, not concentrate at checkout. (Exhibit 4: confidence falls at Size Decision and stays low through Add to Cart and Checkout.)
- An editable, persistent profile builds more trust than cold sizing decisions every visit. (The perceived-control research, Xu & Chen, 2025; see Sources: shoppers who feel in control of their data report higher trust and satisfaction.)
Ideation
Three concepts, each scoped to plug into an existing product page or account flow:
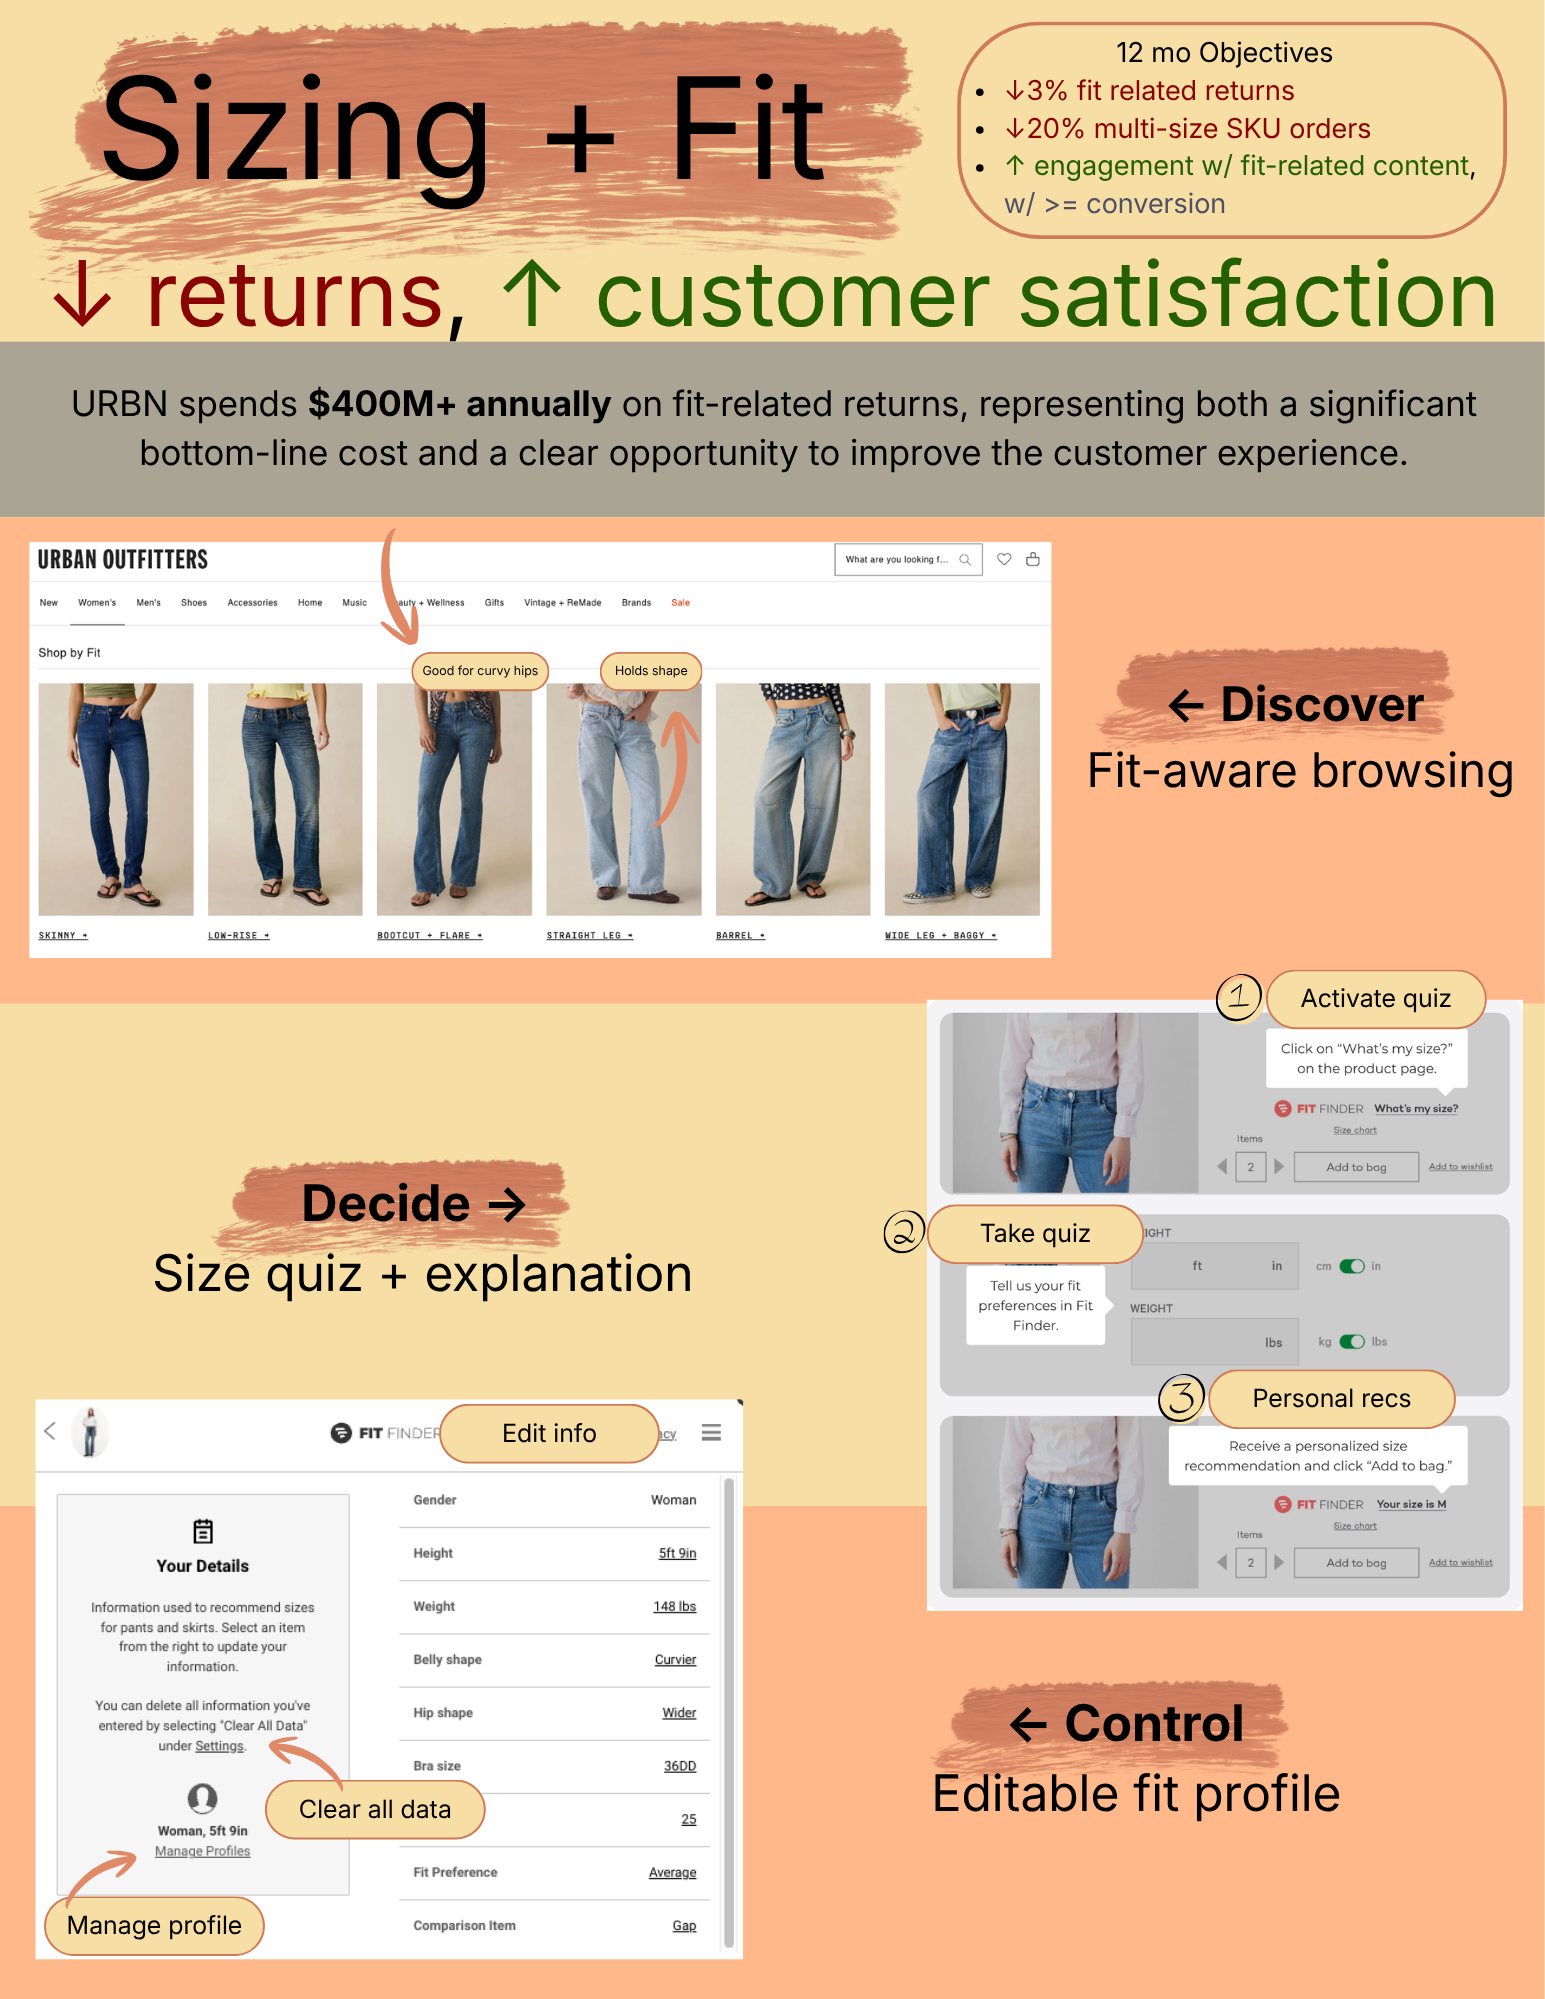
- Discover: fit-aware browsing. Fit cues and “best for [fit]” tags on category tiles, so you can get excited about items that are actually likely to fit.
- Decide: a size quiz + explanation at the PDP. A short quiz triggered right where the size dropdown already lives. It gives you a recommendation and tells you why, so you feel supported in the moment of uncertainty.
- Control: a fit profile that remembers you. Enter your info once, and every recommendation after gets better because of it. It’s yours to edit or clear anytime.
The recommendation
Adopt a size quiz that leads to real fit recommendations, testing through whichever path gets a pilot in front of shoppers fastest: integrating a tool like Fit Analytics, or building a scoped version in-house. Start with a single high-bracketing category, like women’s jeans, the most-returned item. The quiz answers should also become a persistent, editable profile, so shoppers stay in control of their data and every recommendation after gets better.
Fit signals need touchpoints throughout the shopping journey, not just at the size dropdown. Size and fit are part of styling, not a technical spec to get right once. Add sizing and fit copy as customers browse and show them what is most relevant.
How we’d know it’s working
- Returns: tag return reasons at intake (“too small / too big / didn’t fit”) to read the 3% target directly, rather than inferring it.
- Bracketing: detect same-SKU-multiple-size orders at the cart level to track the 20% target.
- Engagement: track quiz starts, completions, and profile edits alongside conversion, so a fit lift never comes at the expense of sales.
Quiz completion rate and profile creation are leading indicators, showing movement within weeks. Returns are lagging: they need a full return-window quarter before the numbers are trustworthy.
Sources
- macrotrends: URBN FY2025 net sales, $5.55B (year ended Jan 31, 2025).
- csimarket: URBN apparel share of revenue, 58.42% (same fiscal year).
- Coresight Research, The True Cost of Apparel Returns: 24.4% online apparel return rate; ~53% fit/size share of returns.
- Ader, Adhi, Chai, Singer, Touse, and Yankelevich, Returning to order: Improving returns management for apparel companies (McKinsey & Company, May 2021): 70% of apparel returns caused by poor fit or style, per a survey of 14 North American apparel retailers.
- Patel, Karlsson, and Oghazi, Fits like a glove? Knowledge and use of size finders and high-end fashion retail returns (Journal of Innovation & Knowledge, 2025): size-finder users 0.65% more likely to return; ~7.5% CLV lift in following quarter.
- Xu and Chen, Personalized recommendations and consumer trust: The role of perceived control and locus of control (Acta Psychologica, 2025): perceived-control theory underlying the persistent fit profile concept.
- True Fit case data: bracketing declines of 24% (Moosejaw) to 30–50% (ASICS) after adopting fit tools.
- Fit Analytics published case studies: return-rate reductions of 2–20% across named retail clients (Breuninger, ARMEDANGELS, Amaro, Mammut, Foot Locker EU).